Alexis Hucteau PhD project

Notes about all the project advances and researches during the PhD
rMATS
Notes about the paper
New statistical model and computer program designed for detection of differential alternative splicing from replicate RNA-seq data.
sensitive to outliers
How to run rMATS code?
Download gitrepo: https://github.com/Xinglab/rmats-turbo/releases/tag/v4.1.1
Install it from the rmats folder and run:
./build_rmats
The test script that creates a conda environment doesn’t work but the main script works
Need fastq or bam files (paired or not), a gtf annotation file and a STAR binary indices containing the SA file (if using fastq)
python ../../rmats_turbo_v4_1_1/rmats.py --b1 bam1.txt --b2 bam2.txt --gtf ~/Annotation_file_gtf/gencode.v38.annotation.gtf -t paired --readLength 50 --nthread 8 --od output/ --tmp tmp/
An example of result:
| EventType | TotalEventsJC | TotalEventsJCEC | SignificantEventsJC | SigEventsJCSample1HigherInclusion | SigEventsJCSample2HigherInclusion | SignificantEventsJCEC | SigEventsJCECSample1HigherInclusion | SigEventsJCECSample2HigherInclusion |
|---|---|---|---|---|---|---|---|---|
| SE | 36 | 64 | 0 | 0 | 0 | 1 | 1 | 0 |
| A5SS | 19 | 23 | 0 | 0 | 0 | 0 | 0 | 0 |
| A3SS | 24 | 30 | 0 | 0 | 0 | 1 | 0 | 1 |
| MXE | 10 | 46 | 0 | 0 | 0 | 0 | 0 | 0 |
| RI | 76 | 102 | 5 | 4 | 1 | 4 | 1 | 3 |
SE = skipped exon
MXE = mutually exclusive exons
A3SS = alternative 3’ splice site
A5SS = alternative 5’ splice site
RI = retained intron
Rmatsashimiplot
Rmatsashimiplot is a git repo that permits to create sashimiplot of the result of rmats
Installation of rmats2sashimiplot
Download the git repo
If using python3, you need to convert python2 script to pyton3 by running:
./2to3.sh -W
Then install it
python ./setup.py install
Example
It need bam/sam files, the coordinates to focus or the row lines of a specific event.
RI.MATS.JC_selected.txt example focusing on VIM gene:
| ID | GeneID | geneSymbol | chr | strand | riExonStart_0base | riExonEnd | upstreamES | upstreamEE | downstreamES | downstreamEE | ID | IJC_SAMPLE_1 | SJC_SAMPLE_1 | IJC_SAMPLE_2 | SJC_SAMPLE_2 | IncFormLen | SkipFormLen | PValue | FDR | IncLevel1 | IncLevel2 | IncLevelDifference |
|---|---|---|---|---|---|---|---|---|---|---|---|---|---|---|---|---|---|---|---|---|---|---|
| 3497 | ENSG00000026025.16 | VIM | chr10 | + | 17235168 | 17236379 | 17235168 | 17235389 | 17235845 | 17236379 | 3497 | 1,3 | 3,4 | 0,0 | 2,0 | 98 | 49 | 1 | 1 | 0.143,0.273 | 0.0,NA | 0.208 |
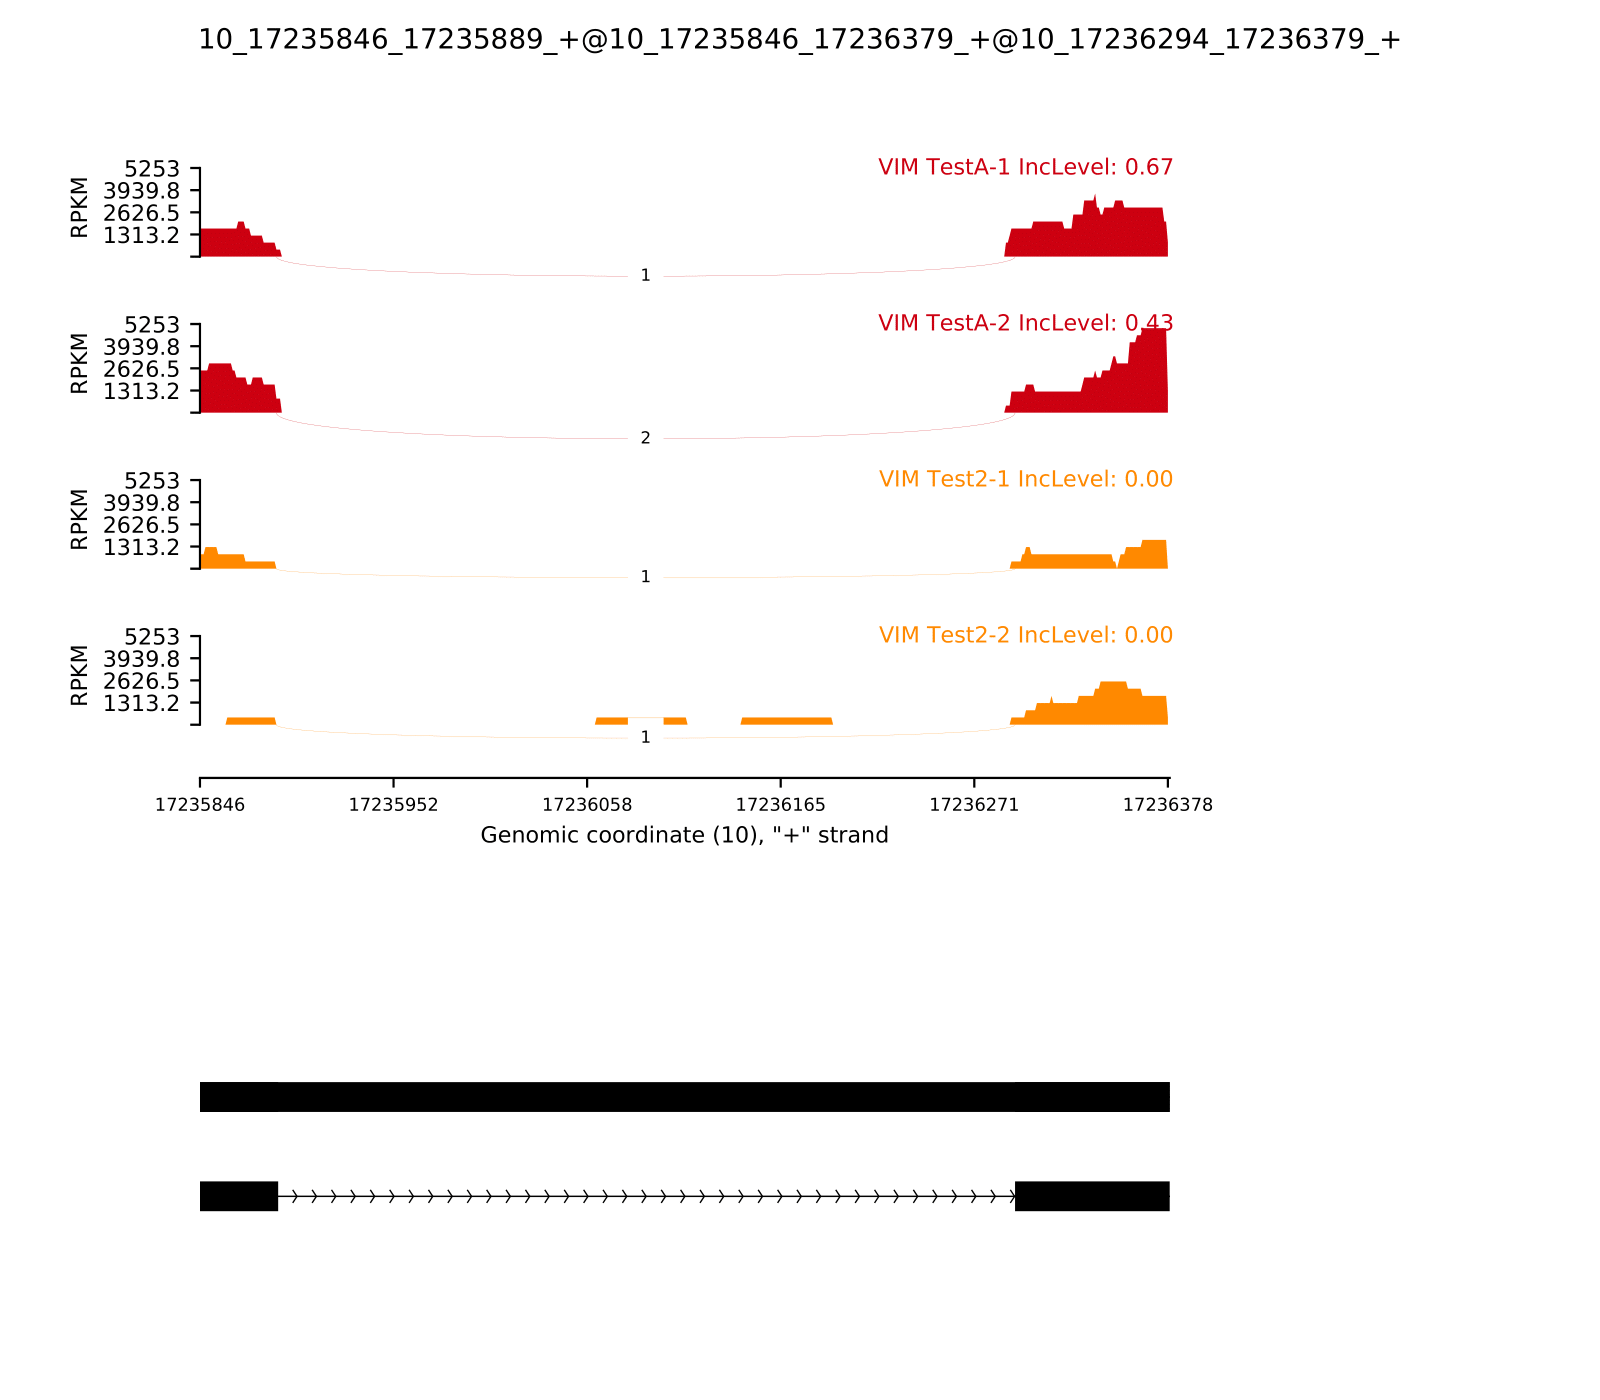
| 3498 | ENSG00000026025.16 | VIM | chr10 | + | 17235845 | 17236379 | 17235845 | 17235889 | 17236293 | 17236379 | 3498 | 4,3 | 1,2 | 0,0 | 1,1 | 98 | 49 | 5.36756132241E-06 | 0.000407934660503 | 0.667,0.429 | 0.0,0.0 | 0.548 |
Example of command:
rmats2sashimiplot --b1 231ESRP.25K.rep-1.bam,231ESRP.25K.rep-2.bam --b2 231EV.25K.rep-1.bam,231EV.25K.rep-2.bam -t RI --l1 TestA --l2 Test2 -o output2/ -e output/RI.MATS.JC_selected.txt
The output is:
